S&P500 Trading Update 30/3/26

S&P500 Trading Update 30/3/26
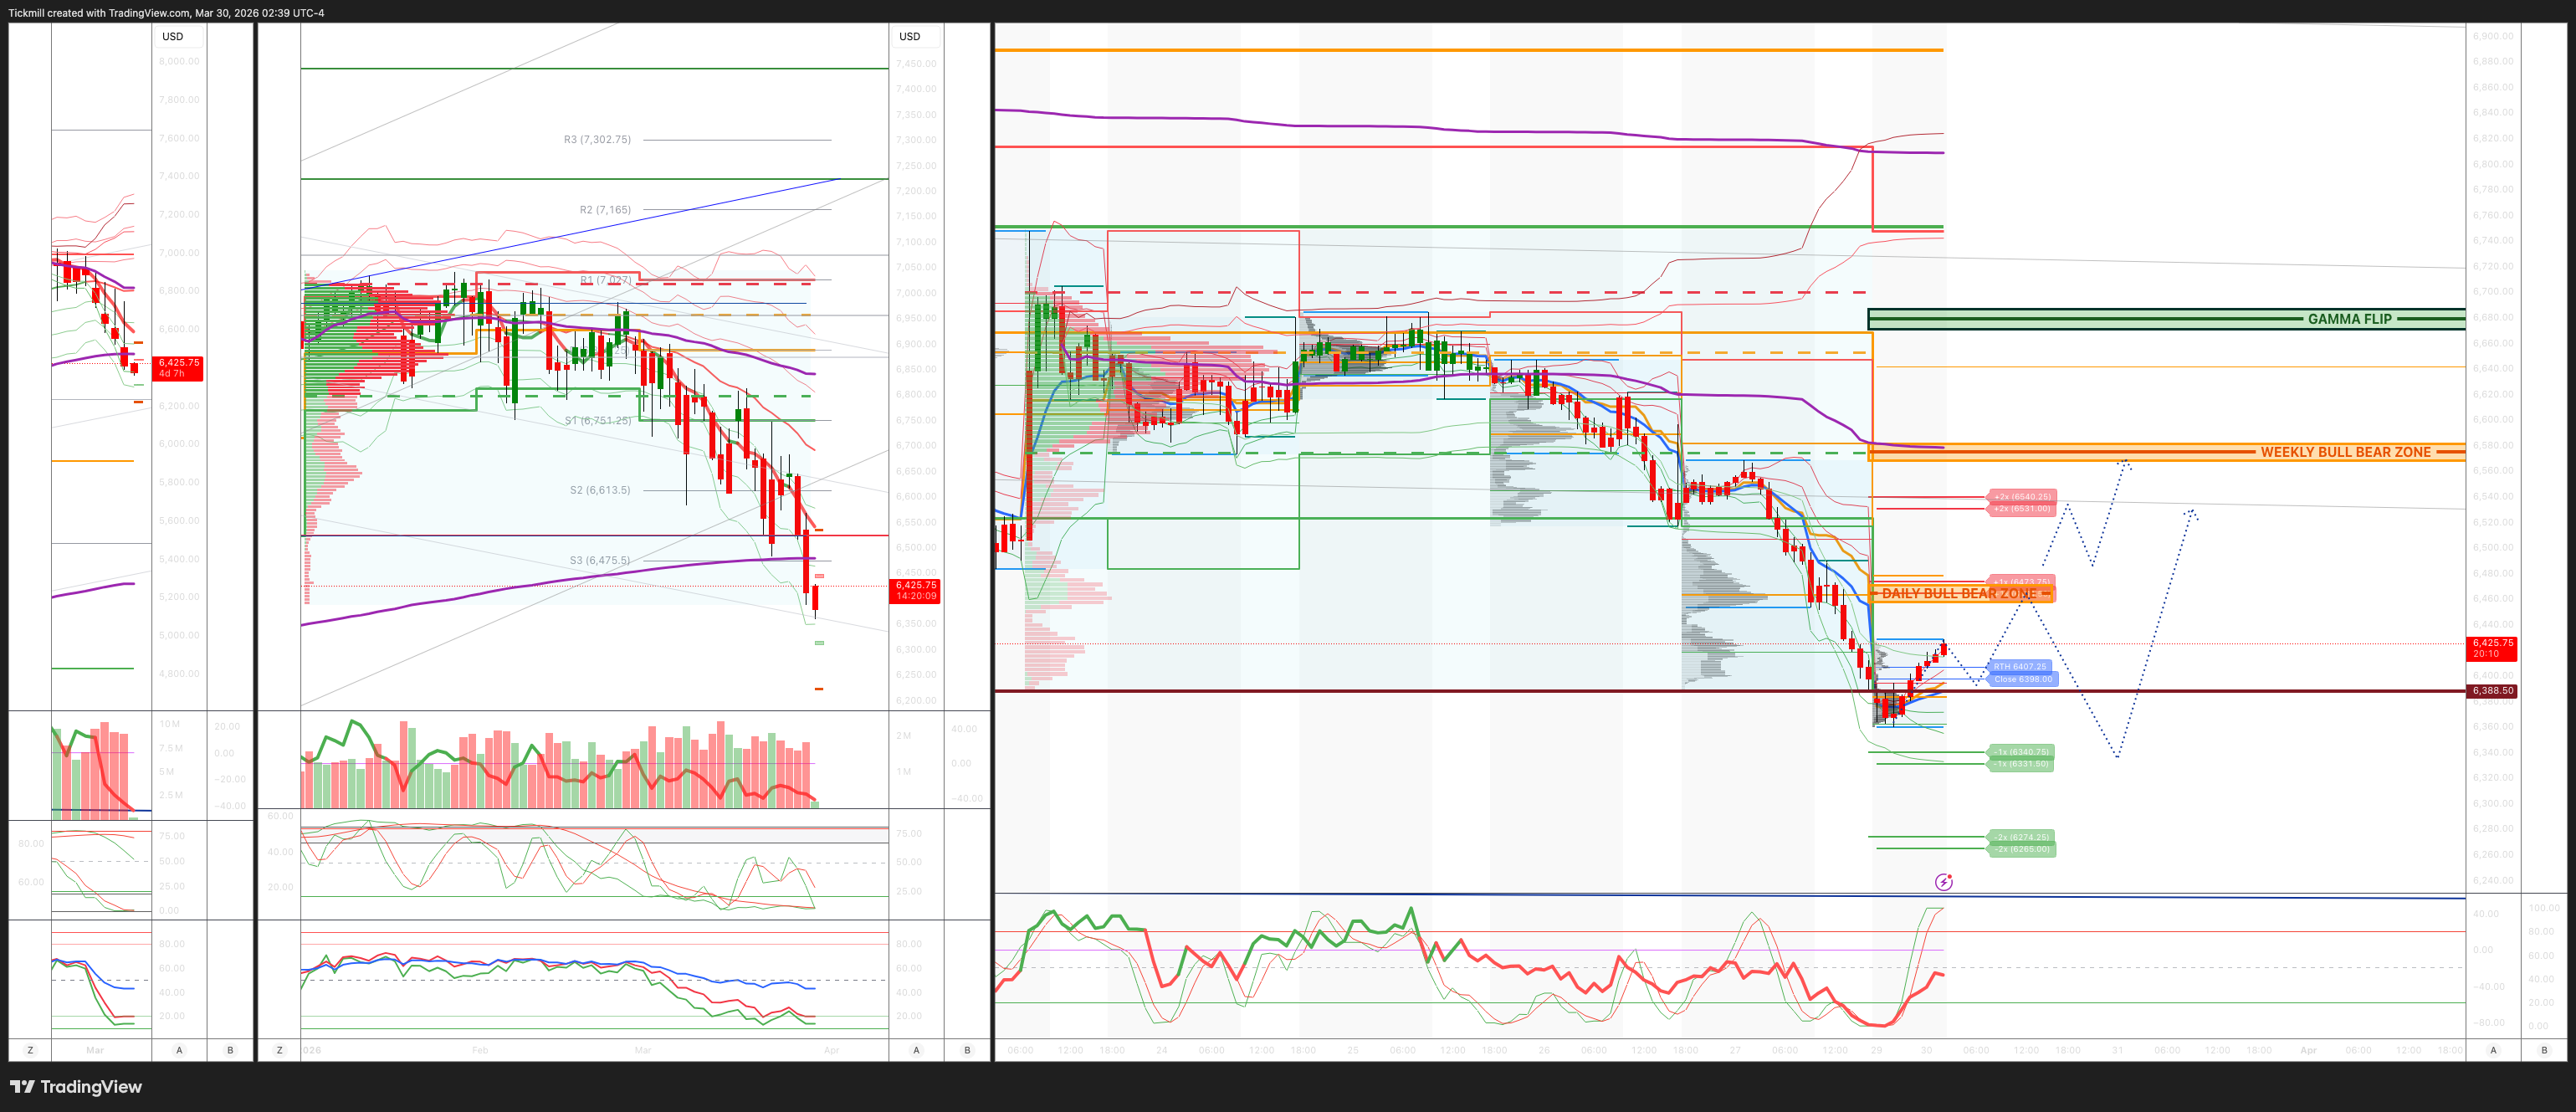
***QUOTING ES1! FOR CASH US500 EQUIVALENT LEVELS, SUBTRACT POINT DIFFERENCE***
WEEKLY BULL BEAR ZONE 6570/80
WEEKLY RANGE RES 6529 SUP 6267
April OPEX Straddle: 328.55pt range implies a OPEX to OPEX range of [6177, 6835]
June QOPEX Straddle is 546.4pt giving us a range of [5960,7052]
DEC2025 OPEX to DEC2026 OPEX is 945 points giving us a range of [5889,7779]
DAILY VWAP BEARISH 6691
WEEKLY VWAP BEARISH 6633
MONTHLY VWAP BEARISH 6785
DAILY STRUCTURE – OTFD - 6495
WEEKLY STRUCTURE – OTFD - 6704
MONTHLY STRUCTURE - OTFD - 6911
Balance: This refers to a market condition where prices move within a defined range, reflecting uncertainty as participants await further market-generated information. Our approach to balance includes favouring fade trades at the range extremes (highs/lows) while preparing for potential breakout scenarios if the balance shifts.
One-Time Framing Higher (OTFH): This represents a market trend where each successive bar forms a higher low, signalling a strong and consistent upward movement.
One-Time Framing Lower (OTFD): This describes a market trend where each successive bar forms a lower high, indicating a pronounced and steady downward movement.
DAILY BULL BEAR ZONE 6460/70
GAMMA FLIP 6680
DAILY RANGE RES 6474 SUP 6340
2 SIGMA RES 6695 SUP 6274
VIX BULL BEAR ZONE 22
PUT/CALL RATIO 1.21 (The numbers reflect options traded during the current session. A put-call ratio below 0.7 is generally considered bullish, and a put-call ratio above 1.0 is generally considered bearish)
TRADES & TARGETS
SHORT ON REJECT/RECLAIM OF DAILY BULL BEAR ZONE TARGET DAILY RANGE SUP
LONG ON ACCEPTANCE ABOVE DAILY BULL BEAR ZONE TARGET WEEKLY BULL BEAR ZONE
(I FADE TESTS OF 2 SIGMA LEVELS ESPECIALLY INTO THE FINAL HOUR OF THE NY CASH SESSION AS 90% OF THE TIME WHEN TESTED THE MARKET WILL CLOSE ABOVE OR BELOW THESE LEVELS)
GOLDMAN SACHS TRADING DESK VIEW - Weekend Thoughts
The day-to-day barrage of headlines around Iran is all-consuming, and game theory is running full tilt.
In many ways, this conflict is the ultimate jigsaw puzzle for market participants.
Here’s a set of thoughts on what I’m seeing, hearing, and thinking. If I had to sum it all up in four words: the tails are fat.
1. Market direction
At the risk of over-reduction, here’s one way to frame the setup.
A tactical bull case
Most everyone I speak with in the professional trading community is bearish, and broad measures of sentiment are collapsing.
On the systematic side, the CTA community has already shed a substantial amount of length.
On the discretionary side, large index shorts are now in place.
RSI on the S&P and NDX hasn’t been this low since last April.
Judging from this week’s news flow, one can imagine the broad contours of a deal framework.
A tactical bear case
Outside certain corners of the fast-money community, capitulation has not yet materialized.
Considering this is the largest oil shock in history, the U.S. market has not sold off all that far.
The physical commodities crowd tells a deeply disquieting story.
Price action in global bond markets is similarly eerie.
The intensity of the conflict has not eased for a critical 48–72 hour stretch.
Where I come out
The first section suggests market technicals are better balanced.
The second argues that the broader set of risks remains skewed toward adverse outcomes.
I expect gap-up / gap-down trading to continue.
Risk/reward is not especially clear to me, but my instinct is that downside asymmetry still outweighs upside asymmetry.
Conclusion: I still see no reason not to simplify risk, raise a bit more cash, and be positioned to throttle up on the other side of this — easier said than done, I know.
2. From the road
I spent a few days in Europe this week. To repeat a recent comment: those who know the most about physical commodities seem more worried than the generalists.
What we’re talking about here is an ongoing and severe disruption in the physical flow of oil, gas, and refined products — and the policy restrictions that can follow, including export bans, fuel rationing, and mandated work-from-home.
On one side of the ledger, this is bad for business: inflation by any ther name, with increasingly meaningful consequences for growth.
On the other side, these are physical markets that live in the reality of today, while equities discount forward conditions and should respond quickly to any genuine truncation of the left tail.
3. Which leads to this
At this stage, markets are mostly treating the situation as a supply-driven inflation shock, and not yet as a meaningful growth shock.
You can see this across asset classes. One bright-and-shining example is the brutal selloff in global front-end rates.
On the equity side, cyclical parts of the market have outperformed, both outright and relative to defensives. Check out ticker GSPRGDPT.
My view is that the longer this drags on, the more vulnerable the market becomes to a genuine growth scare. As a colleague put it, “the market is increasingly short time.”
4. Plane reading
Looking back through some notes this week, I was reminded how messy things were a year ago.
From the February highs to the April lows, the S&P drew down 19%
The VIX spiked above 65 in the summer of 2024
The BKX index fell 35% around SVB in 2023
The NDX dropped a full 33% in 2022
Omicron and Delta repeatedly spooked markets in the fall of 2021
All of that, of course, pales in comparison to peak-COVID fireworks.
I say this only to illustrate that, in the context of prior episodes, the damage in this one has not yet been that significant.
As a client recently remarked, “geopolitics don’t always matter in the way market participants expect.”
5. Europe
I’ve received plenty of questions about whether the trading community will stick with the length accumulated in European equities last year.
Judging from GS PB data, the answer is a hard-and-fast no.
It’s also worth noting that we cut our 2026 Euroland GDP forecast to roughly half its pre-conflict level and now call for two ECB hikes, in April and June: link.
6. Asia
In contrast to the prior point, I’d argue that Asian equities are trading fairly well.
Take Korea as an example: amid steady foreign selling and a sudden correction in U.S. memory names, the KOSPI is still up a full 29% YTD.
Alongside that, I’m impressed with Japan’s resilience given its commodity sensitivity. Note that the TPX still managed a 1% rally this week.
Based on what I hear from clients, Korea and Japan are the two markets where investors retain the most medium-term confidence.
7. Flow of funds / positioning
The story in hedge fund land remains clear as day: net exposure has been cut to modest levels, while gross exposure remains notably high.
Across the full GS PB book, measured against the past three years:
Net exposure sits in the 33rd percentile
Gross exposure sits in the 100th percentile
While equity long/short clients have actively reduced gross over the past three weeks, my instinct — especially in the context of very high realized volatility in the momentum factor — is that it needs to be culled further.
Away from the levered community, the picture is more mixed:
Active long-only funds have been net sellers
Quarter-end should bring pension fund demand
That could also improve gamma dynamics for option dealers
8. Something I learned this week
The bottom 300 companies in the S&P comprise just 13% of the index.
The top five companies alone comprise 28%.
Credit to The Daily Shot.
9. Something else I learned this week
Total gross supply this year in U.S. investment-grade bonds is around $14 trillion: link.
10. The options market
For all the recent wildness, if you’ve been buying short-dated gamma and simply sitting on it, you really haven’t been paid.
While the chart below doesn’t tell the full story, it does capture rolling P/L from being long 1-week S&P straddles.
As Shawn Tuteja pointed out to me:
Since August 2024, VIX calls haven’t carried well
Since April 2025, S&P gamma hasn’t carried well
In his words: “It’s almost as if the market, once it draws down on a trade, doesn’t make it easy for that trade to work subsequently.”
There are periods when short-dated index options are enormously useful and make navigation easier.
Unfortunately, this hasn’t been one of them.
Disclaimer: The material provided is for information purposes only and should not be considered as investment advice. The views, information, or opinions expressed in the text belong solely to the author, and not to the author’s employer, organization, committee or other group or individual or company.
Past performance is not indicative of future results.
High Risk Warning: CFDs are complex instruments and come with a high risk of losing money rapidly due to leverage. 69% and 73% of retail investor accounts lose money when trading CFDs with Tickmill UK Ltd and Tickmill Europe Ltd respectively. You should consider whether you understand how CFDs work and whether you can afford to take the high risk of losing your money.
Futures and Options: Trading futures and options on margin carries a high degree of risk and may result in losses exceeding your initial investment. These products are not suitable for all investors. Ensure you fully understand the risks and take appropriate care to manage your risk.
Patrick has been involved in the financial markets for well over a decade as a self-educated professional trader and money manager. Flitting between the roles of market commentator, analyst and mentor, Patrick has improved the technical skills and psychological stance of literally hundreds of traders – coaching them to become savvy market operators!