USD/RUB Drops, What’s Next?
Good day!
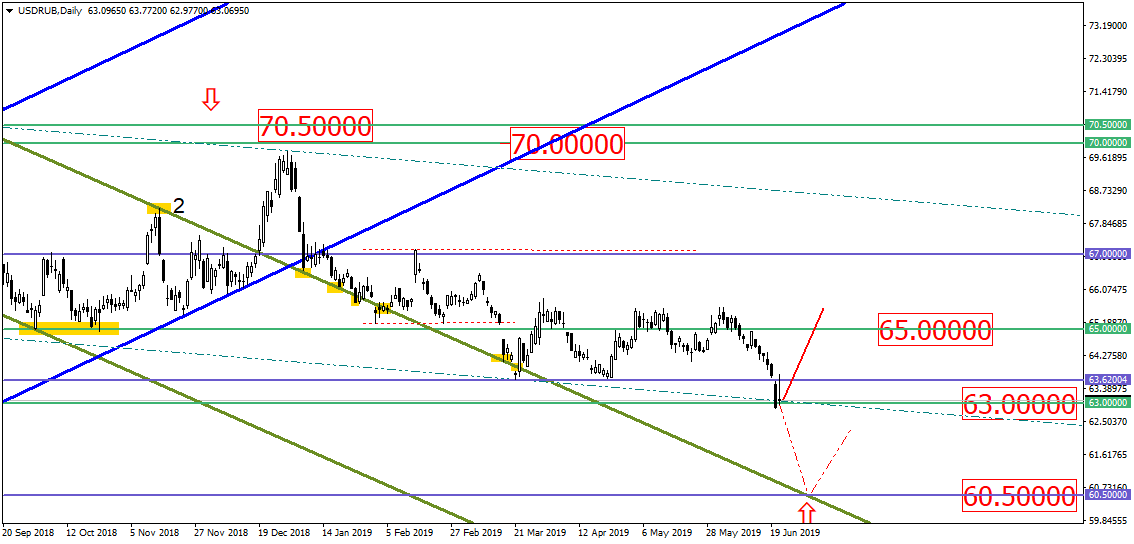
Based on the decision by the FOMC, the USD/RUB approached the 63 level and closed the trading week right there. Now, we could assume that this asset will either pull back from the 63.00 support level or break through it and drop till the 60.50 level. So far, the pullback is potentially more likely. Here we should rely on the candlestick formations that should be visible next week:
Based on the reports by CОT CFTC, large operators quickly expanded short positions on the Russian ruble, with optimism that there could be a potential jump of the USD/RUB. This matter may indirectly confirm the possible jump of the asset from the 63.00 level. Checking the chart with the positions of large operators, we can see that the trend is gradually reversing downwards:
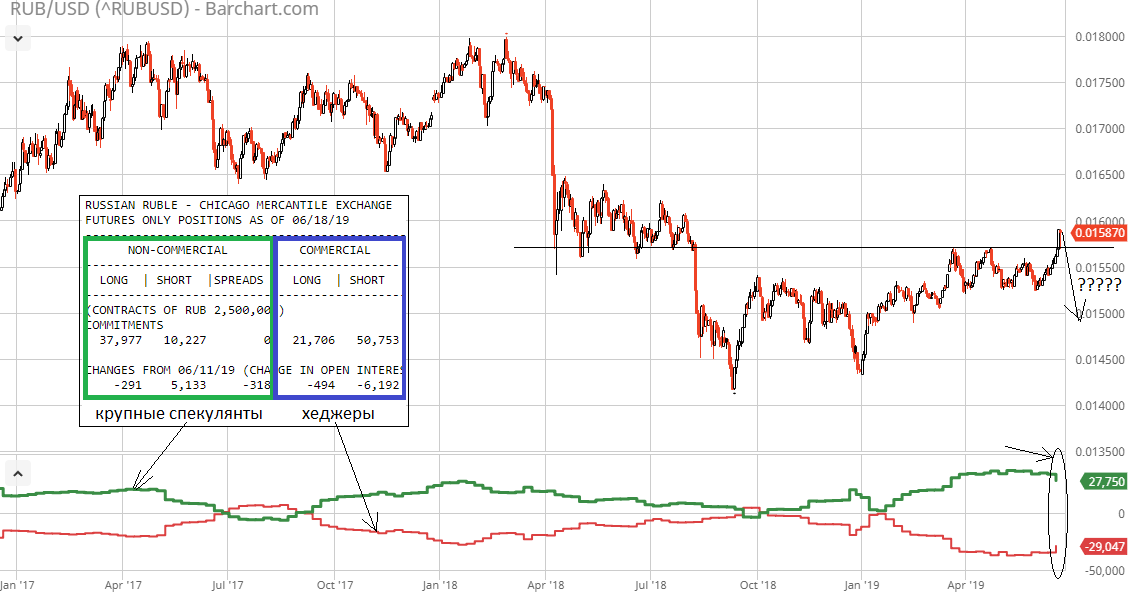
Hedgers
WTI oil is trying to correct itself after its recent drop. However, oil may face resistance in the area between the broken uptrend and the new downtrend. Although the asset’s price may quickly touch the level of 65 dollars per barrel, leaving a fine long spike:
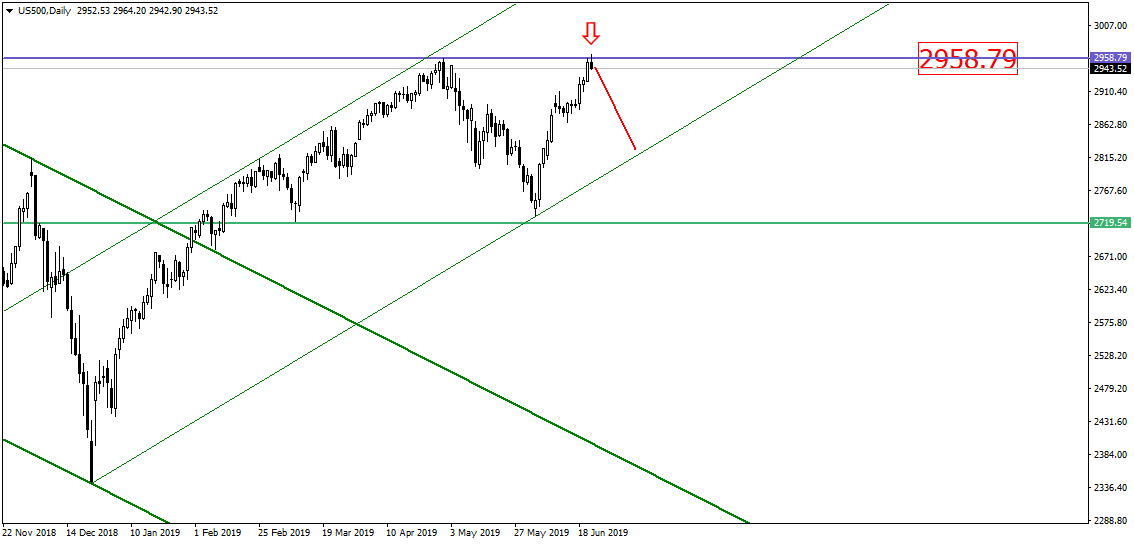
The S&P500 index quickly broke the historical maximum at the 2958.79 level and headed downwards, closing the trading day above the resistance level. So far, it could be assumed that this index should drop:
The most recent market reviews can be found in our company’s blog located at www.blog.tickmill.com/ru/
Follow us on twitter to read some recent news, get some trading idea and much more: www.twitter.com/Tickmill_RUS
Please note that this material is provided for informational purposes only and should not be considered as investment advice. Trading in the financial markets is very risky.
Oleg Svirgun, market expert of the brokerage company Tickmill
Short description of the blog post: Today we review the current status of Russian ruble, oil and index S&P500.
Disclaimer: The material provided is for information purposes only and should not be considered as investment advice. The views, information, or opinions expressed in the text belong solely to the author, and not to the author’s employer, organization, committee or other group or individual or company.
Past performance is not indicative of future results.
High Risk Warning: CFDs are complex instruments and come with a high risk of losing money rapidly due to leverage. 71% and 74% of retail investor accounts lose money when trading CFDs with Tickmill UK Ltd and Tickmill Europe Ltd respectively. You should consider whether you understand how CFDs work and whether you can afford to take the high risk of losing your money.
Futures and Options: Trading futures and options on margin carries a high degree of risk and may result in losses exceeding your initial investment. These products are not suitable for all investors. Ensure you fully understand the risks and take appropriate care to manage your risk.