Institutional Insights: Goldman Sachs SP500 Poisoning & Key Levels 2/7/25
.jpeg)
US Equoty Positioning and Key Levels
FICC and Equities
Consolidated Recap of GS Positioning Metrics
Summary:
1. CTA Corner:
- CTAs currently hold $67bn in global equities (61st percentile) after offloading $9.2bn last week.
- In the US, CTAs hold $22bn. Projections for the next week indicate selling in the US, but buying is expected over the next month in flat or upward market scenarios.
2. GS PB Performance:
- Equity Fundamental L/S Performance Estimate: Increased by +1.65% (6/20–6/26) compared to MSCI World TR’s +2.20%. This was driven by beta gains of +1.16% and alpha gains of +0.49%, primarily from long-side performance.
- Equity Systematic L/S Performance Estimate: Declined by -0.07% during the same period due to beta losses of -0.34%, partially offset by alpha gains of +0.27%.
3. Buybacks:
- Last week’s buyback volumes were 0.5x 2024 YTD ADTV and 0.6x 2023 YTD ADTV, with activity skewed towards Financials, Tech, and Health Care sectors.
Charts in Focus:
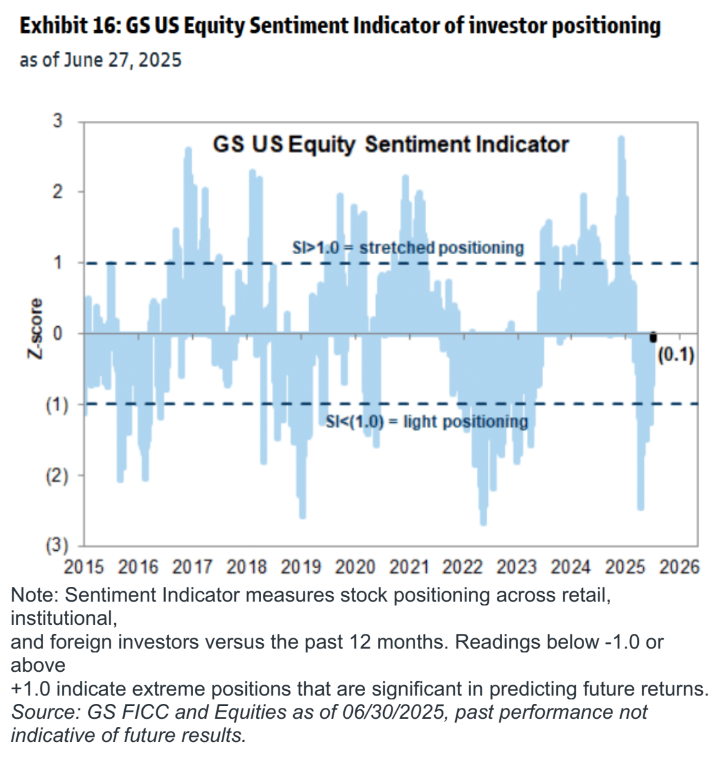
- Sentiment Indicator
- US Panic Index
- Risk Appetite Indicator
- SPX vs. Singles Skew
- Call Skew vs. Put Skew
- S&P Futures Liquidity
- Funding Spreads vs. S&P 500
CTA Corner – Detailed Flows:
Over the Next 1 Week:
- Flat Market: Buyers $8.44B ($1.80B into the US)
- Up Market: Buyers $7.89B ($1.18B into the US)
- Down Market: Sellers $18.46B ($2.49B out of the US)
Over the Next 1 Month:
- Flat Market: Buyers $82.23B ($22.44B into the US)
- Up Market: Buyers $87.20B ($20.98B into the US)
- Down Market: Sellers $125.22B ($40.47B out of the US)
Key SPX Pivot Levels:
- Short Term: 5918
- Medium Term: 5846
- Long Term: 5598
Disclaimer: The material provided is for information purposes only and should not be considered as investment advice. The views, information, or opinions expressed in the text belong solely to the author, and not to the author’s employer, organization, committee or other group or individual or company.
Past performance is not indicative of future results.
High Risk Warning: CFDs are complex instruments and come with a high risk of losing money rapidly due to leverage. 69% and 73% of retail investor accounts lose money when trading CFDs with Tickmill UK Ltd and Tickmill Europe Ltd respectively. You should consider whether you understand how CFDs work and whether you can afford to take the high risk of losing your money.
Futures and Options: Trading futures and options on margin carries a high degree of risk and may result in losses exceeding your initial investment. These products are not suitable for all investors. Ensure you fully understand the risks and take appropriate care to manage your risk.
Patrick has been involved in the financial markets for well over a decade as a self-educated professional trader and money manager. Flitting between the roles of market commentator, analyst and mentor, Patrick has improved the technical skills and psychological stance of literally hundreds of traders – coaching them to become savvy market operators!