Institutional Insights: Goldman Sachs Flow of Funds 'Tricks Before Treats'

GS Flow of Funds: Tricks Before Treats
Watch for volatile price movements as we approach month-end: The latter half of October often experiences turbulent trading, driven by dealer short gamma positioning, reduced liquidity, and heightened activity tied to mutual fund fiscal year-end.
Looking ahead, November presents a more optimistic outlook for U.S. equities. Key drivers include active corporate buybacks, $1.966 trillion in mutual fund AUM reporting year-end, favorable fund flows, and consistent retail demand.
Recommended hedges:
- SPX Dec 97% Put with 25 VKO, currently priced at approximately 0.53%.
- USD 19Dec25 .SPX<95% & 10ySOFR<ATMF CMS-0.25%, currently priced at approximately 6.7% (credit to Angela Tang). Maximum loss is limited to the premium paid.
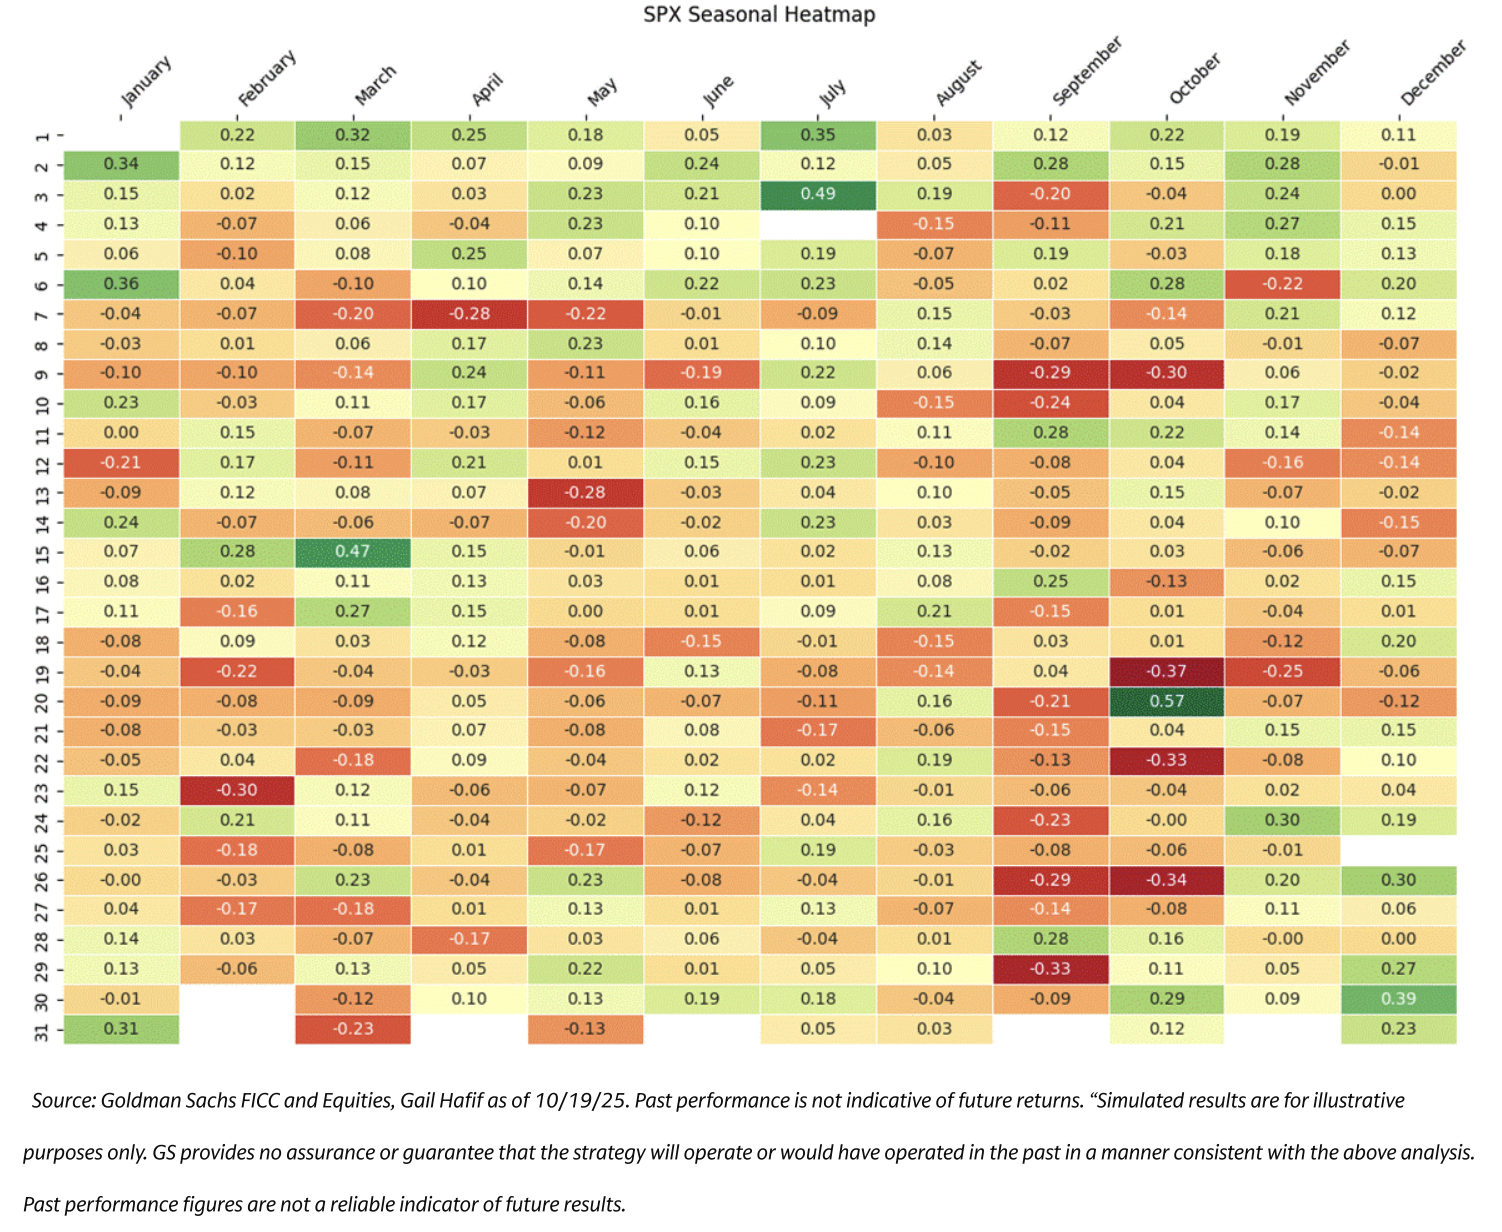
1. Seasonality Insights:
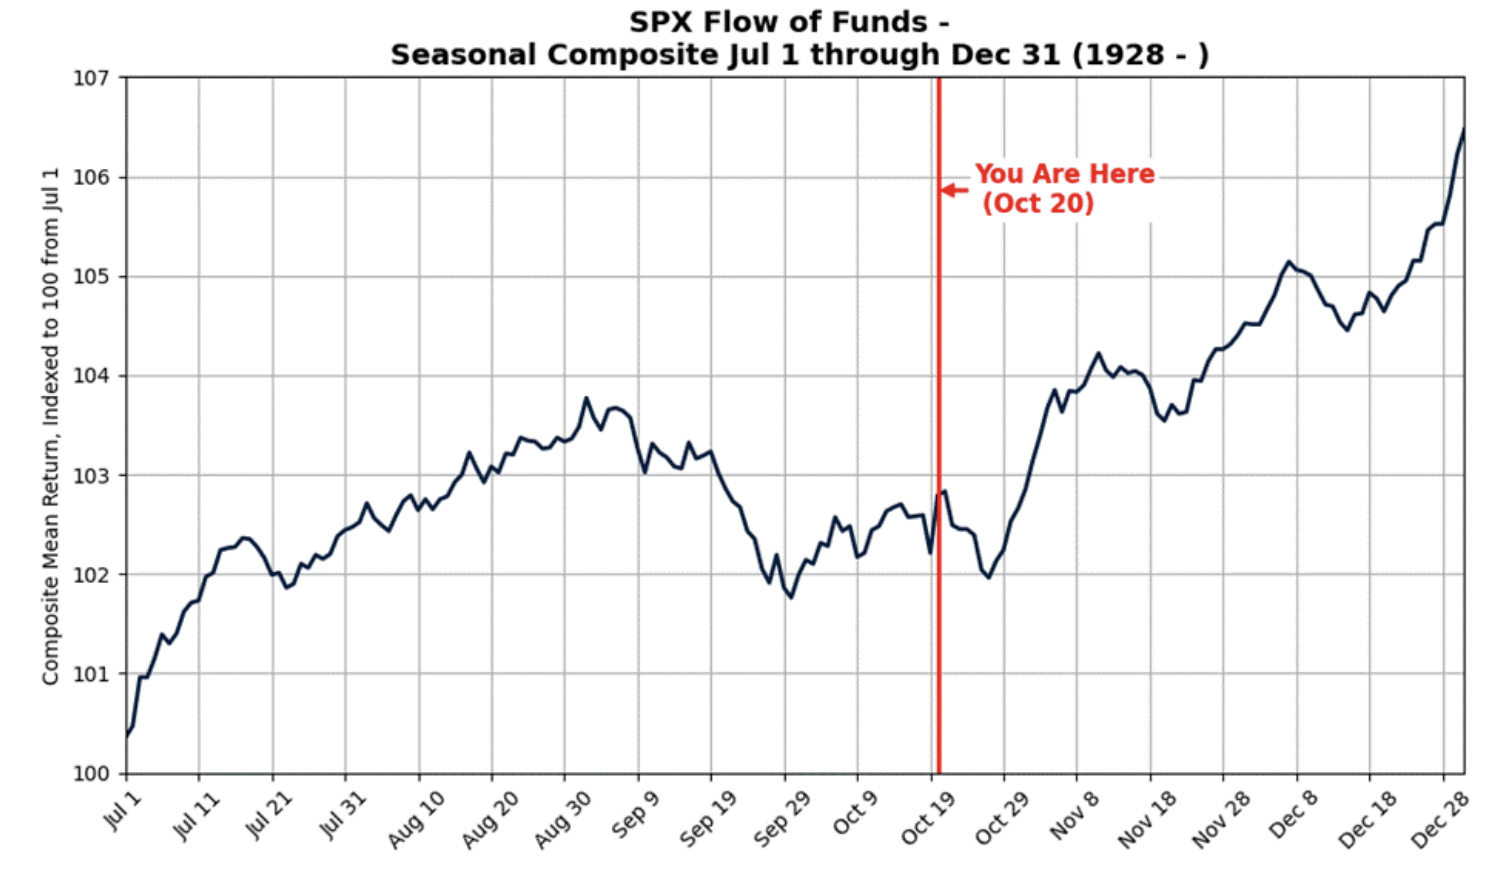
Historically, October 20th has been the strongest trading day of the year since 1928, with an average return of +57bps. However, the remainder of October often features choppy trading before the year-end holiday rally kicks in.
- The S&P 500 has delivered an average return of +4.16% between October 20th and December 31st since 1928.
- The Nasdaq-100 (NDX) has achieved an average return of +8.48% over the same period since 1985.
Mutual Funds
Mutual funds, a significant seller of U.S. equities, are expected to reduce activity in the coming weeks as 718 funds report their year-end, representing $1.966 trillion in assets. October marks the peak month for mutual fund fiscal year-ends, which will alleviate a major headwind for equities heading into November.
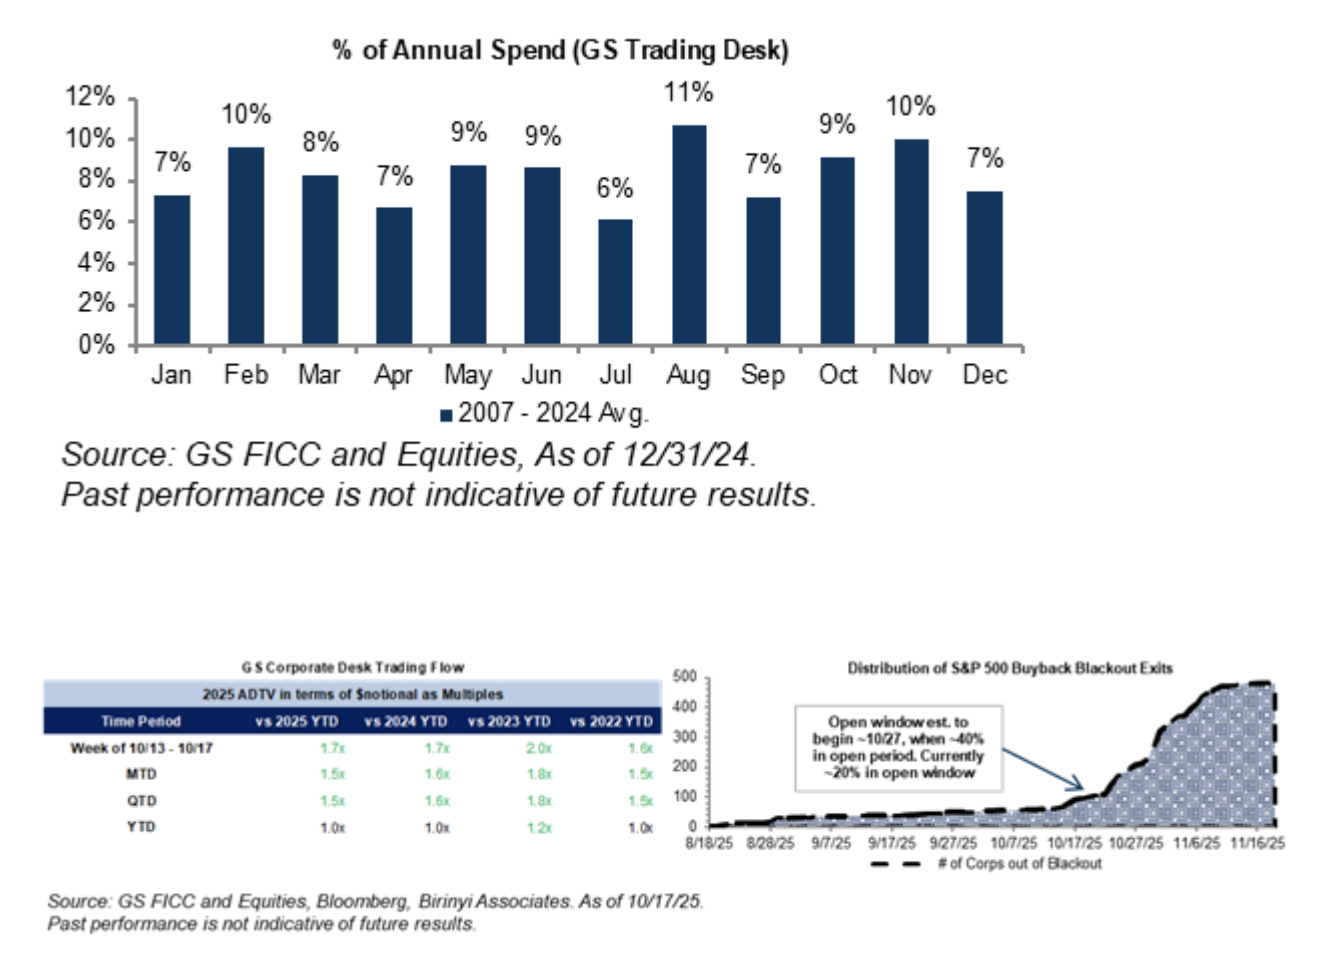
Buybacks
As mutual fund selling slows, corporate buybacks are set to gain momentum. We estimate the current blackout period will end around October 24, with approximately 40% of companies entering an open window thereafter.
Our desk flows showed strength last week, finishing at 1.7x compared to 2024 year-to-date averages and 2.0x versus 2023 year-to-date averages, with activity skewed toward Technology, Financials, and Consumer Discretionary sectors. Historically, Q4 sees heightened buyback activity as companies aim to meet year-end repurchase targets.
Fund Flows
Mutual funds and related investment products continued to see strong demand for equities, though bond inflows slowed. Global equity funds experienced robust net inflows during the week ending October 15, totaling $28 billion compared to $20 billion in the previous week.
At the sector level, technology funds attracted significant inflows, followed by commodity funds, reflecting investor interest in these areas.
Gamma
Dealers have shifted from a neutral to short gamma position, intensifying market movements. This is evident in the wide intraday trading ranges, a trend likely to persist in the near term.
For example, S&P futures were down 1% in pre-market trading on Friday but opened unchanged—a rapid shift that underscores the current volatility. Our model indicates that dealers are short gamma at current levels but tend to extend their gamma exposure during moderate rallies before shortening again. On the downside, dealer gamma positioning remains consistently short during selloffs.
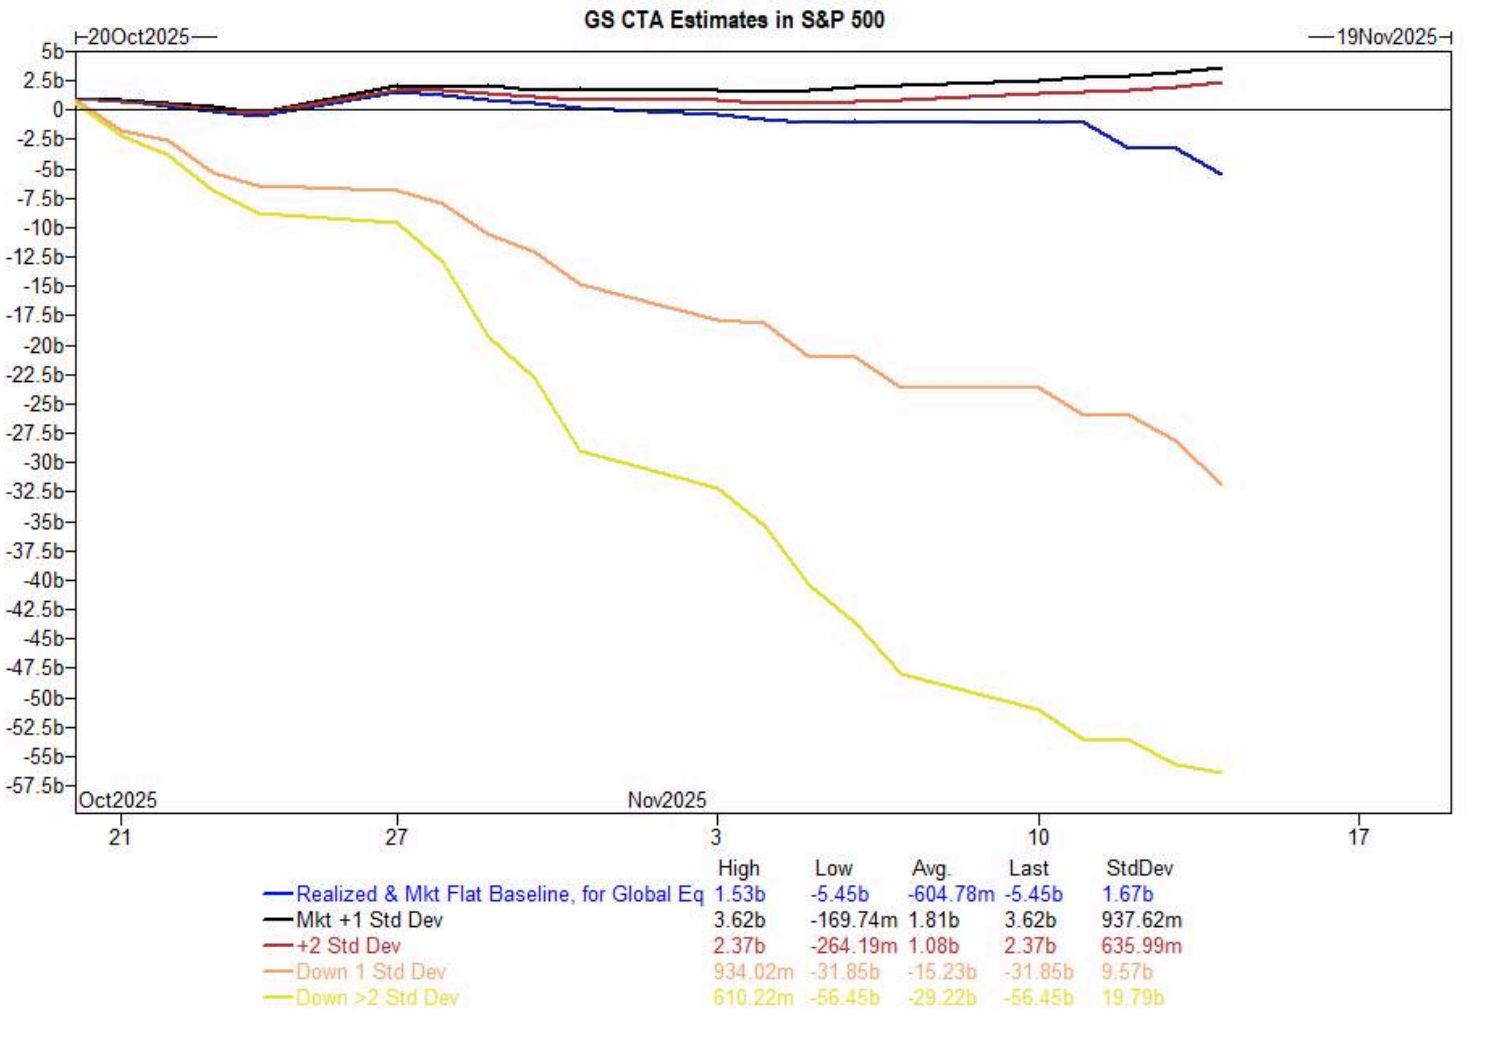
Bonus Point: CTAs
While Commodity Trading Advisors (CTAs) have largely stayed on the sidelines recently, their activity could increase as medium-term realized volatility changes. We are closely monitoring this group for signs of heightened engagement in the near future.
Disclaimer: The material provided is for information purposes only and should not be considered as investment advice. The views, information, or opinions expressed in the text belong solely to the author, and not to the author’s employer, organization, committee or other group or individual or company.
Past performance is not indicative of future results.
High Risk Warning: CFDs are complex instruments and come with a high risk of losing money rapidly due to leverage. 69% and 73% of retail investor accounts lose money when trading CFDs with Tickmill UK Ltd and Tickmill Europe Ltd respectively. You should consider whether you understand how CFDs work and whether you can afford to take the high risk of losing your money.
Futures and Options: Trading futures and options on margin carries a high degree of risk and may result in losses exceeding your initial investment. These products are not suitable for all investors. Ensure you fully understand the risks and take appropriate care to manage your risk.
Patrick has been involved in the financial markets for well over a decade as a self-educated professional trader and money manager. Flitting between the roles of market commentator, analyst and mentor, Patrick has improved the technical skills and psychological stance of literally hundreds of traders – coaching them to become savvy market operators!